In the northeast long established hawkwatch locations (with the exception of some coastal sites) are irrefutable evidence of where, in past years, the most broad-wings have been seen. Hawkwatchers have always wanted to see hawks and gravitated to and thus perpetuated the best sites. Unproductive sites eventually faded away.
Vermont is not, on the whole, broad-wing country and therefore it is not hawkwatch country. Of the approximately 106 hawkwatch sites tried in Vermont over the last five decades only Putney Mt in the southeast corner of the state has persisted although in recent years two other sites are again reporting (Mount Ascutney State Park and Mount Philo).
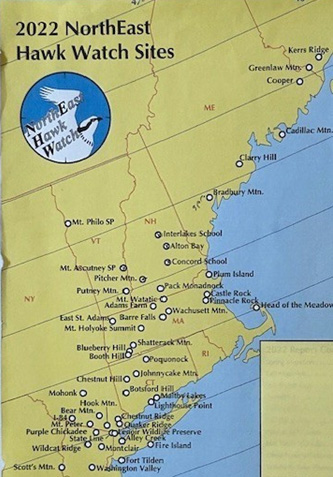
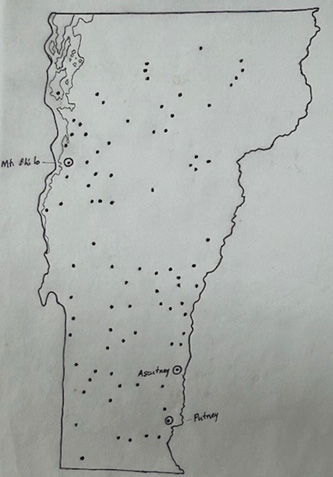
All indicators are that Putney Mt was, at least until recently, perilously close to the western edge of the east coast flyway. Sites to its east routinely saw a lot more birds. While attempting to understand such distribution watchers at Putney have noted that during the broad-wing push the weather fronts and associated northwest winds so beloved by most sites are for them not necessarily a positive: often they produce a single good broad-wing day or a few good days in what ultimately proves to be a below average year while sites further east have much better seasons.
This has led us to speculate that the location of the more easterly watch sites is reflective of the “typical” more fall-like weather experienced when these sites were established. However, due to climate change, September is becoming increasingly a “summer” month and three of the last seven years have produced surprisingly high broad-wing counts at Putney Mt and relatively low counts at more easterly sites. While Putney’s counts are not high by the historical standards of the sites to its east, the observations of Putney Mt hawkwatchers may lend credence to the idea that warmer, calmer fall weather allows broad-wings to move on a broader front while colder more active fall weather with its frequent fronts and prevailing northwest winds tends to concentrate birds on a more easterly route.
The differences between these weather patterns is often subtle and the onset of fall-like weather may occur anytime between mid-August and early October.
Therefore this is not an either/or proposition. Weather is infinitely variable. But, three of the last seven raptor migration seasons have been unusually summer-like and during these seasons Putney has, by its standards, been broad-wing rich. As you will notice in chart #3 Putney has historically seen fewer broad- wings than Pack Monadnock, NH and they have seen fewer than Mt. Wachusett, MA.

Chart #4 shows that when Mt. Wachusett has a big year (2013, 2022, 2023), sites to their west tend to have progressively lower totals. Inversely, when Putney Mt has a big year (2017, 2018, 2021) sites to their east have progressively lower totals. Total birds tallied for the three included sites is higher when birds are concentrated along the easterly route and lower when they fan out to the west. I believe that this holds true for the entire northeast indicating a probable site distribution bias. Three-site totals are often lowest when Pack Monadnock has the highest count.


Chart #5 shows that Pack Monadnock has higher totals and less count variation than Putney indicating that they are likely positioned to benefit regardless of which weather pattern prevails. As the birds slosh back and forth in the east coast flyway like feathered ocean tides sites toward the center of that flyway should stand the best chance of intercepting them and should have the most consistent and often the highest counts.
Chart #6 compares total raptors counted at Putney Mt with total raptors counted at Quaker Ridge, CT. That Putney’s best years barely match Quaker’s worst years would seem to hint that while birds are being seen in greater numbers at Putney these are still far more birds to account for and these birds are in all likelihood still on a more easterly path.
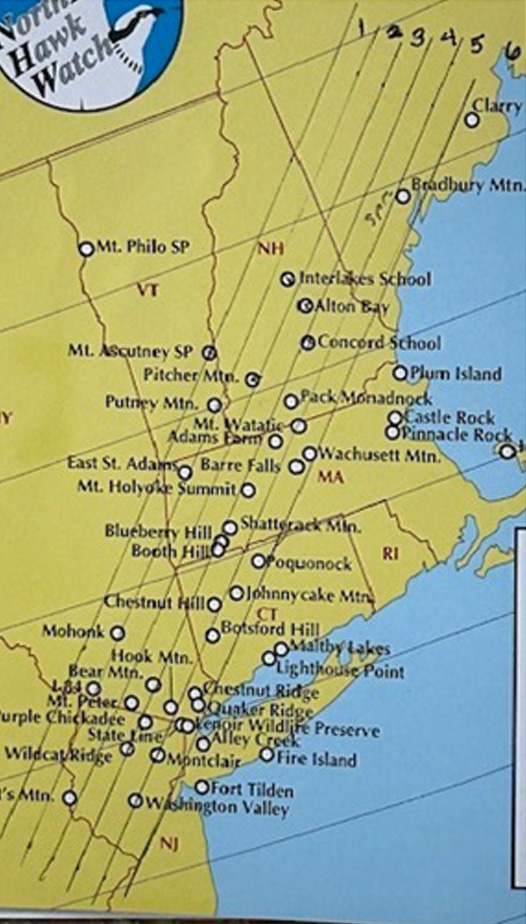
Map 6 is an attempt to better understand site distribution by arbitrarily delineating zones. Zone 1 which includes Putney has a total of five fall watches. Zone 2 has just two. Zone 3 has four. Zone 4 has ten as does zone 5.
The high concentration of watches in the eastern side of the flyway probably reflects high watcher satisfaction; observers at these sites have historically seen a lot of broad-wings.

All of this makes me suspect that a greater understanding of the variability of east-west broad-wing distribution within the east coast flyway could provide answers to the question that arises ever more frequently, “Where are the broad- wings?” If it’s a warm summer-like season they may be flying over Putney Mt. If it’s cooler and more fall-like you might look to points east.
Having raised the possibility of an intermittent and increasingly common westward shift in the broad-wing flight path I’ll now offer some ideas that may help explain those shifts. And what is more illuminating when pondering the distribution of broad-winged hawks in the east coast flyway than data on Monarch Butterflies? Note the population peaks and valleys and the years of their occurrence as I believe that they are pertinent and relatable to the subject at hand.
At the suggestion of one of our watchers I overlaid our broad-wing data onto this monarch data. The similarities proved striking. With this comparison a pattern of high and low counts seemed both possible and worthy of a further investigation.
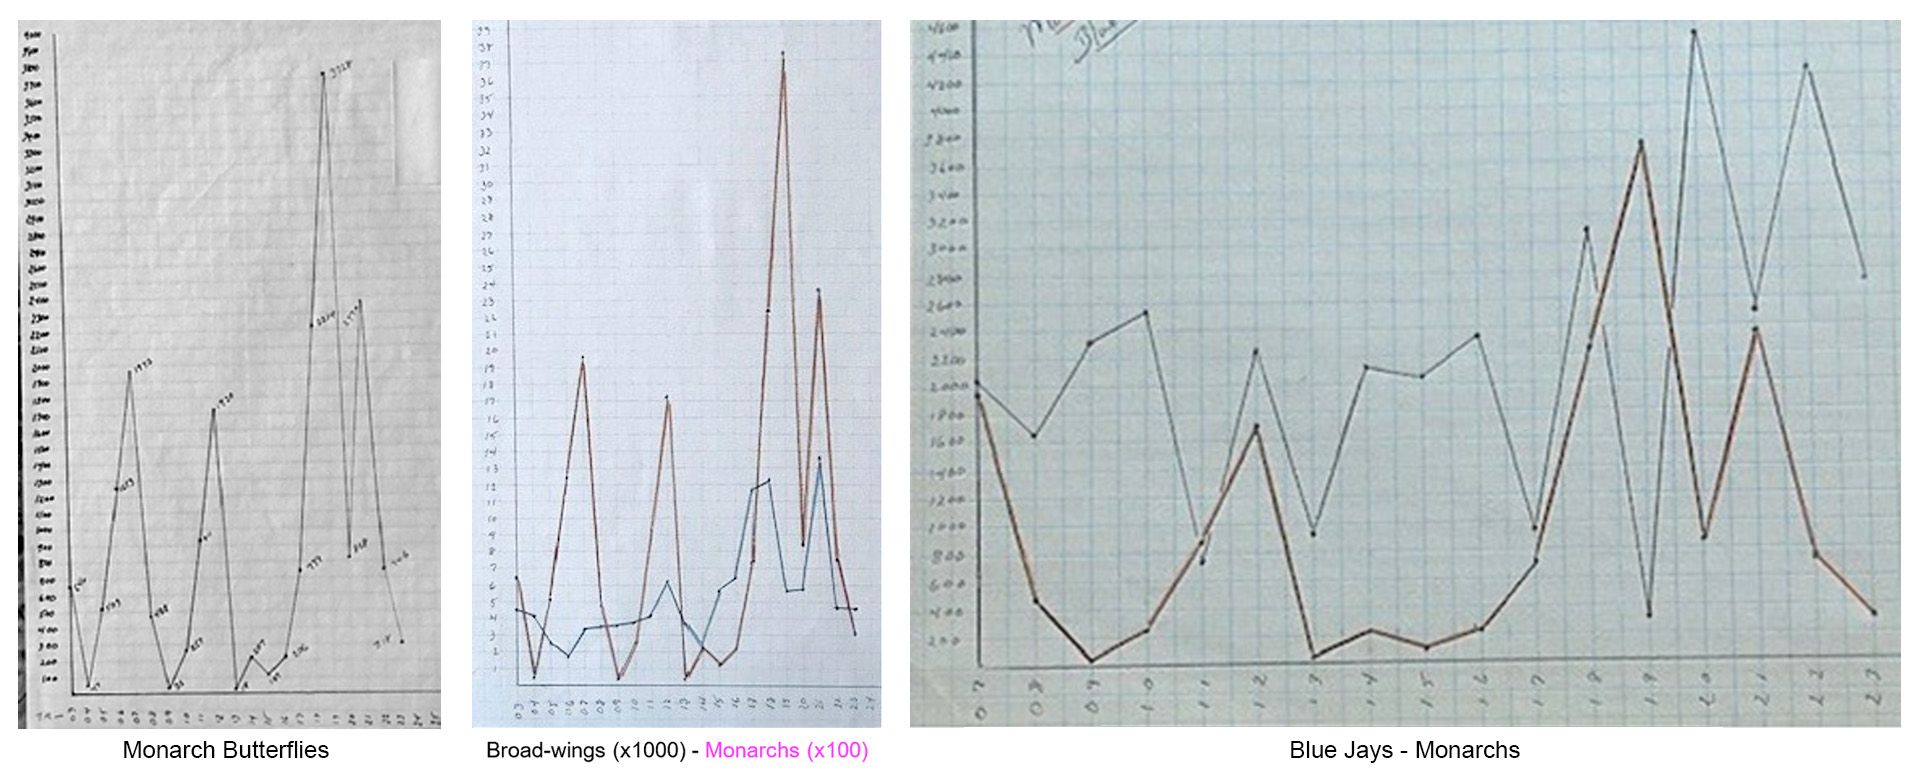
Out of idle curiosity I then compared our Blue Jay counts with our monarch counts. With the exception of 2012, blue jay numbers were down when monarchs were up and up when monarchs were down. Same pattern, opposite results. In 2019 when our blue jay numbers were at their all time low and our monarch numbers at their all time high, one of the watchers traveled west across New York State and reported numerous mobs of migrating jays crossing the interstate. The blue jays flight path had, it seems, shifted west out of our area while the monarch and broad-wing flight path had also shifted west but into our area. As you can see by the graph the inverse also happens. When they all shift east broad-wings and monarchs are scarce. Blue jays are seen in abundance.
A survey of migrating Nighthawks performed by a retired 50 year veteran of local hawkwatches at a site north of Putney again showed remarkable similarities to our monarch data. As this count was done independent of our efforts it gave me at least some confidence that the patterns I was seeing were not merely a result of some Putney Mountain biases or errors.
A comparison of broad-wings to nighthawks showed an even closer matches than the monarch comparison. I then compared our rather limited Canada Goose data set with our monarch numbers. This showed the same inverse pattern as our blue jay comparisons.
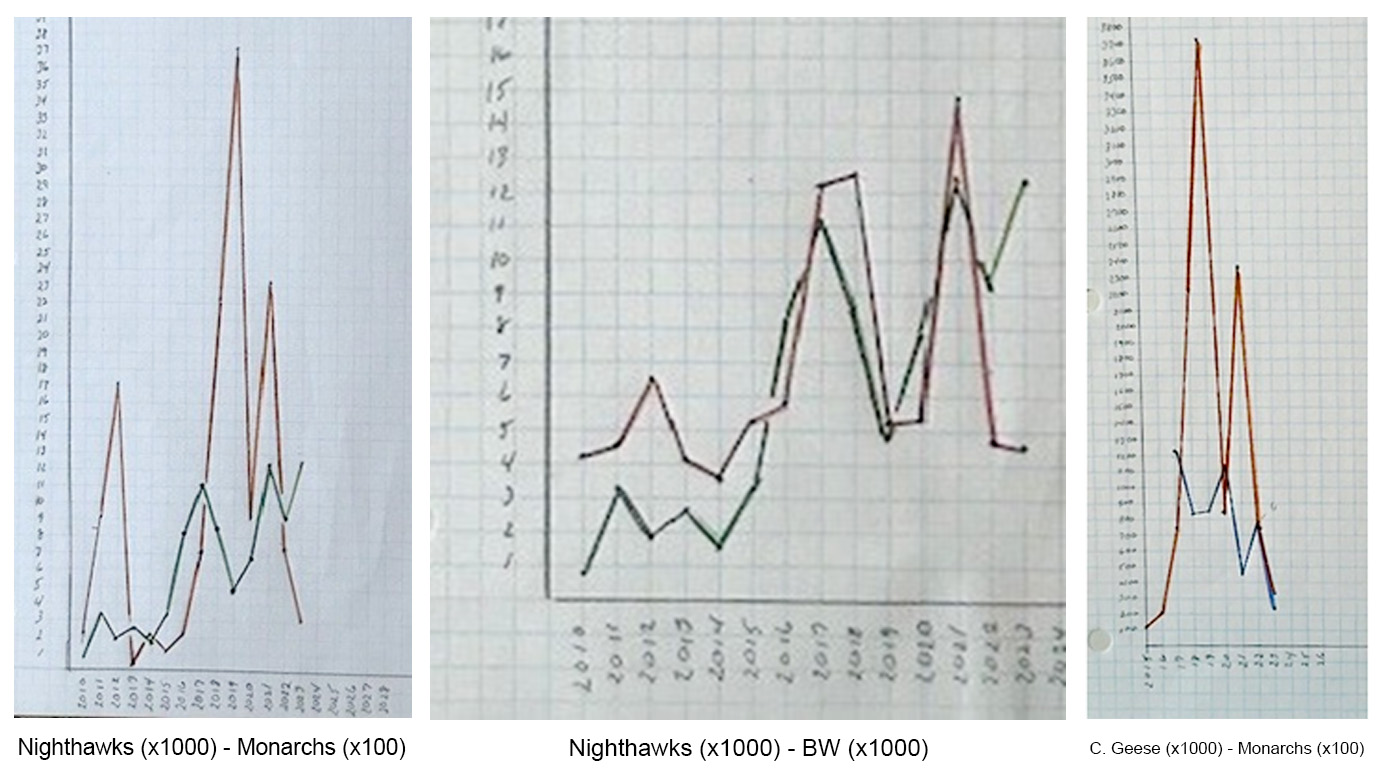
As I have been asked whether other raptor species follow the same pattern as the broad-wings I have included a broad-wing/sharp shinned comparison, a bald eagle/monarch comparison and a sharp shinned/monarch comparison. All seem to have too many points of agreement for their similarities to be coincidence.
Having the same pattern of highs and lows, or the inverse, show up so many times amid species as diverse as monarch butterflies, broad-wings, nighthawks and blue jays convinced me that the only common denominator for these species was weather.
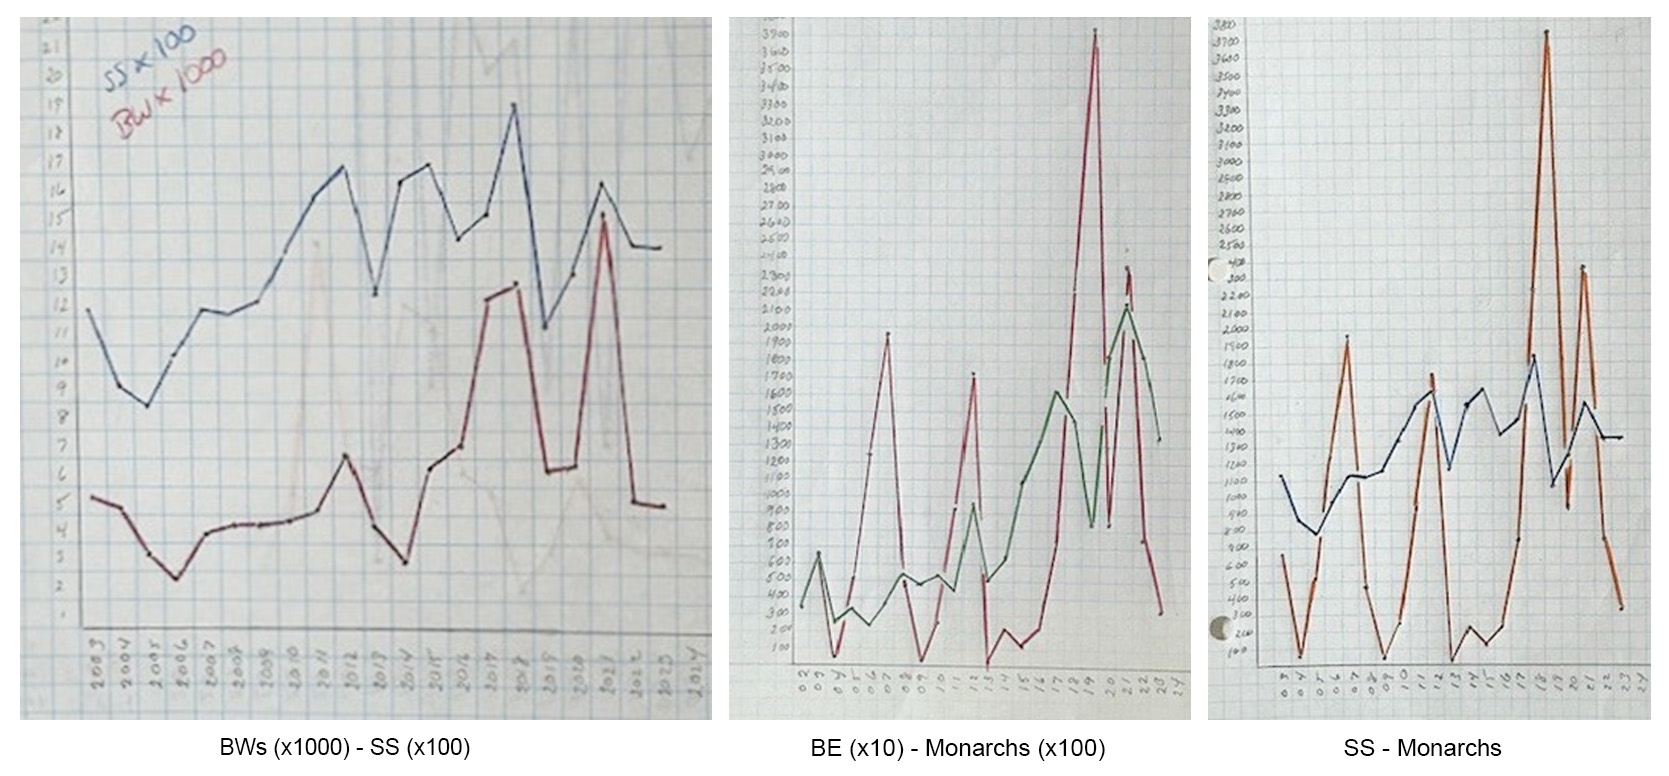
As all weather seems to have its origins in the Pacific Ocean I started further explorations by accessing the NOAA Oceanic Nino Index and immediately noticed that our monarch lows seemed to neatly coincide with strong El Nino spikes. I calculated our average annual monarch total (then 800) indexed it to the neutral line on the NOAA chart and arbitrarily assigned a value of 200 monarchs to each of the pre-existing lines on that chart. The results mapped out low monarch counts during El Nino spikes and high monarch counts during periods dominated by La Nina.
Our broad-wing data when added to the El Nino chart along with the monarch data is equally suggestive. Especially during recent years.
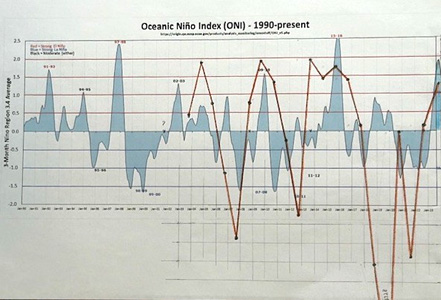
As the El Nino cycle corresponded with low monarch and broad-wing counts and the La Nina cycle corresponded with high monarch and broad-wing counts I dubbed Monarch and Broad-wings those cycles the bad baby and the good baby and thus the intriguingly erratic multi- species count results we see from Putney Mountain came to be called the bad baby-good baby oscillation. The B.B.G.B.s for short. Of course Putney’s Bad Baby cycle would be the Good Baby cycle for the traditionally located sites to our east.
Long established watch locations in the northeast are I believe irrefutable evidence of where the most broad-winged hawks have historically been seen. Any belief that broad-wings will be seen at those sites with the regularity that they have been in the past may require ignoring the evidence that’s before us. Things seem to be changing.
The last few years have given us a bad case of statistical whiplash and it may get worse. I suspect that our warming and more erratic climate might bring increasing numbers of migrating raptors to southeastern Vermont during La Nina cycles while during El Nino cycles they may be increasing more numerous along their traditional more easterly flight path.
These somewhat speculative observations using only the available raw data were made from the geographically marginal vantage point of Putney Mountain in southeastern Vermont the very marginality of which give it a unique and I would argue insightful perspective. The best place to see high tides and low tides is, after all, the beach.
Credits: Nighthawk data was collected by Don Clark et al. and is used here with his permission. All other species data was collected by the ever-evolving crew at the Putney Mt Hawkwatch.
About the author: John Anderson lives in Dummerston Vermont, has been a Putney Mt regular since 1996 and can be contacted at ncooper17@comcast.net


